
September 18, 2026
The Best Server Monitoring App for iPhone in 2026
Seven iPhone apps that show CPU, memory, disk, network, GPU, and Docker for your servers, compared on what they monitor, whether they need an agent, platforms, and price.
On this page
- The short answer
- The seven at a glance
- 1. SwiftServer
- What each card shows
- The dashboard and Global View
- Widgets and Live Activities
- Every platform, and the other half of the app
- 2. ServerCat
- 3. NeoServer
- 4. ServerBox
- 5. Docker Server Admin
- 6. WhaleDeck
- 7. Nezha Mobile
- What about Netdata and Datadog?
- How to pick
- FAQ
Checking a server from your phone used to mean a web dashboard built for a much larger screen. In 2026 a handful of App Store apps are made for the job, and most get their numbers the way a sysadmin would: over SSH, with the commands that read /proc and nvidia-smi, and nothing installed on the server. This guide compares seven of them on coverage, agents, server platforms, terminal, and price.
The short answer
- SwiftServer for most people. Agentless monitoring of Linux, macOS, and Windows servers, NVIDIA GPU included, beside a full SSH terminal, SFTP, and a Docker panel, in one native app for iPhone, iPad, and Mac. Three servers are free.
- ServerCat for a free Linux dashboard where the terminal is optional.
- NeoServer for a broad checklist under a subscription, on the phone; its Mac app is the phone layout on a desktop.
- ServerBox if you want open source and push alerts through its optional agent.
- Docker Server Admin and WhaleDeck if containers are the whole job.
- Nezha Mobile if you already run a Nezha dashboard.
The seven at a glance
| App | Needs an agent | Server OS | Metrics | Terminal | Docker | Mac app | Price |
|---|---|---|---|---|---|---|---|
| SwiftServer | No | Linux, macOS, Windows | CPU per core, temperature, load, memory, swap, processes, network with history, disk I/O, NVIDIA GPU, IP location | Yes, with Mosh | Full panel | Native | Free for 3 servers; Premium $9.99/yr or $34.99 once |
| ServerCat | No | Linux, partial macOS | CPU, GPU, memory, network, disk, Docker | Premium | Yes | Yes | Free; $5.99/yr, $18.99 once |
| NeoServer | No | Linux | CPU, temperature, memory, GPU, disk, network, processes | Yes | Docker, Podman | Phone layout | $24.99/yr, $59.99 once |
| ServerBox | Optional | Linux, Unix, Windows | CPU, memory, disk, network, GPU, temperature, S.M.A.R.T., systemd | Yes | Docker, Podman | iPad app on Apple silicon; DMG on GitHub | Free, open source |
| Docker Server Admin | No | Linux | Load, CPU, memory, disk I/O, network, per-container stats | Yes | Yes | iPad app on Apple silicon | $29.99 or $59.99 |
| WhaleDeck | No | Linux | Host CPU, memory, disk, network, containers | No | Yes | Yes | $20.99/yr, $57 once |
| Nezha Mobile | Yes, plus a dashboard | Linux, Windows, macOS, OpenWrt | CPU, memory, disk, network | Through the dashboard | No | Yes | $0.99 |
1. SwiftServer
SwiftServer reads each server over the SSH access you already have, with plain, read-only commands. Every machine gets a status page, the most complete on this list.
What each card shows
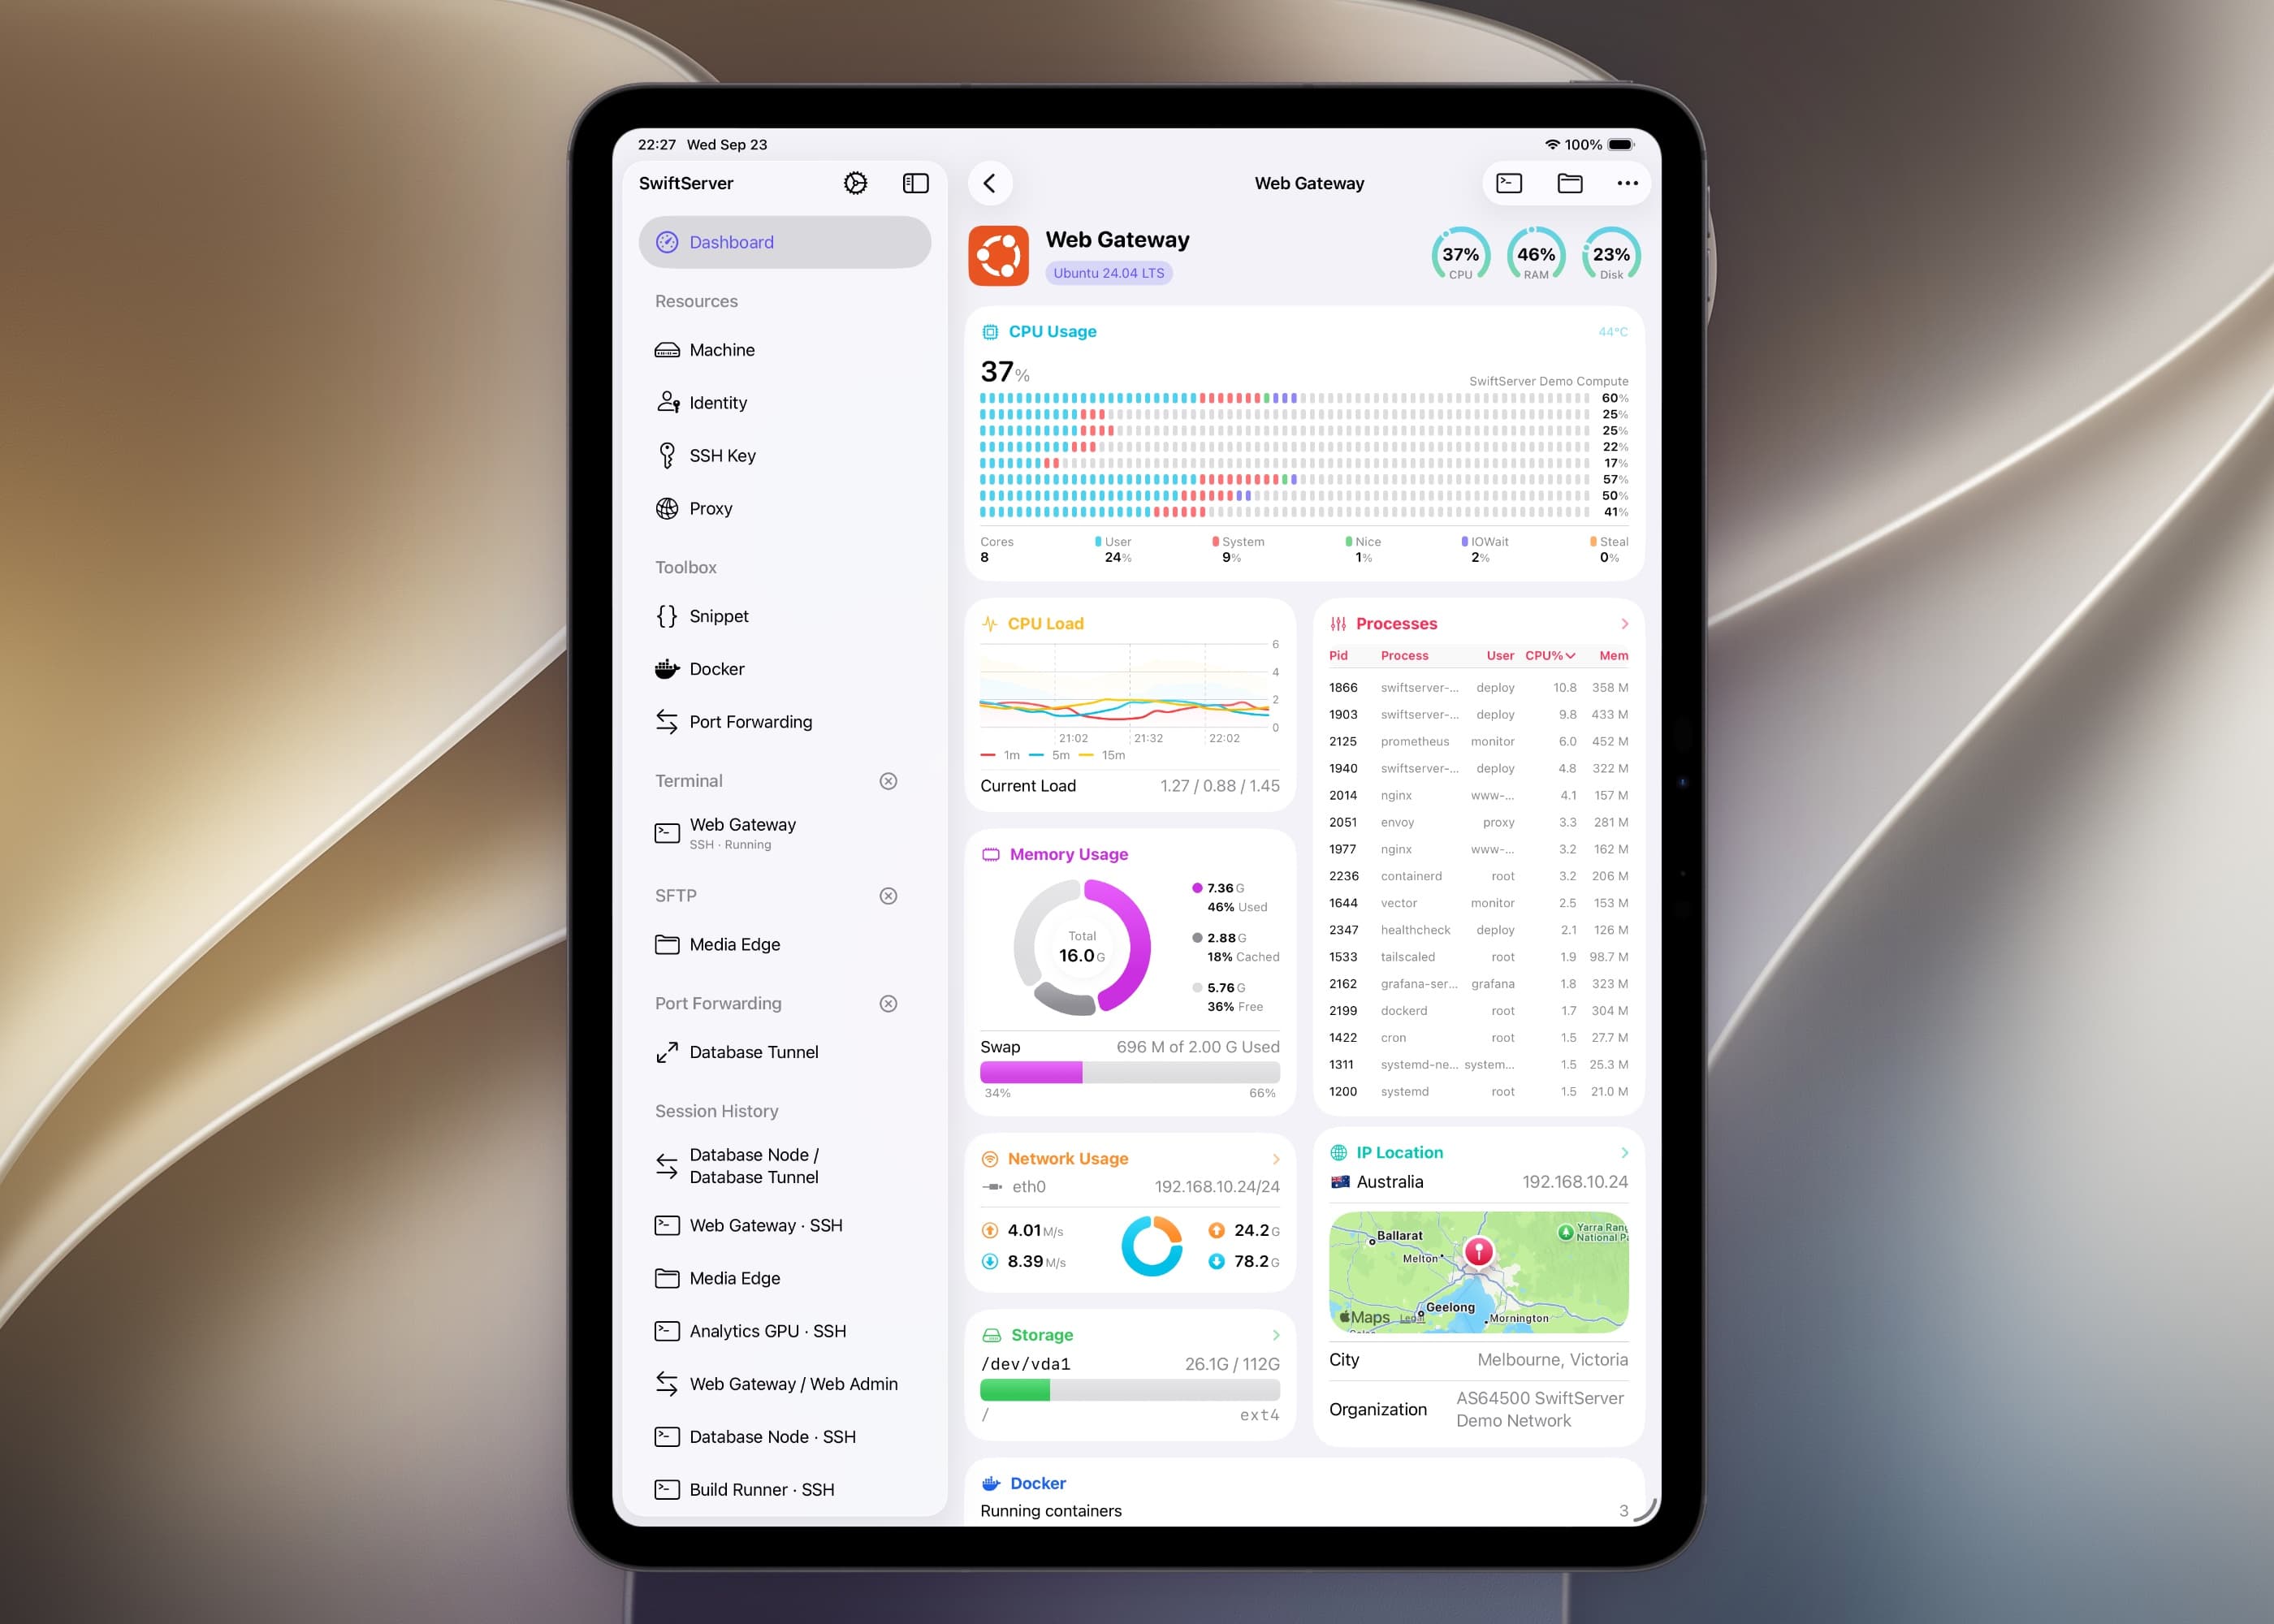
CPU shows every core as its own bar, split into user, system, nice, I/O wait, and steal time, with the CPU model and temperature where the host exposes it. Load charts the 1, 5, and 15 minute averages over time. Memory is a donut of used, cached, and free, with swap on its own row, so 90 percent "used" on a Linux box stops looking alarming. Processes is a live table, sortable by any column and searchable by name, PID, or user. Network shows speed and totals per interface, and with vnStat installed, history by hour, day, week, month, and year. Storage lists every volume with read and write speed, latency, and IOPS. NVIDIA GPU shows utilization, VRAM, fan, temperature, power, and the processes holding each card. IP Location maps the server with city, organization, ASN, and network type.
The dashboard and Global View
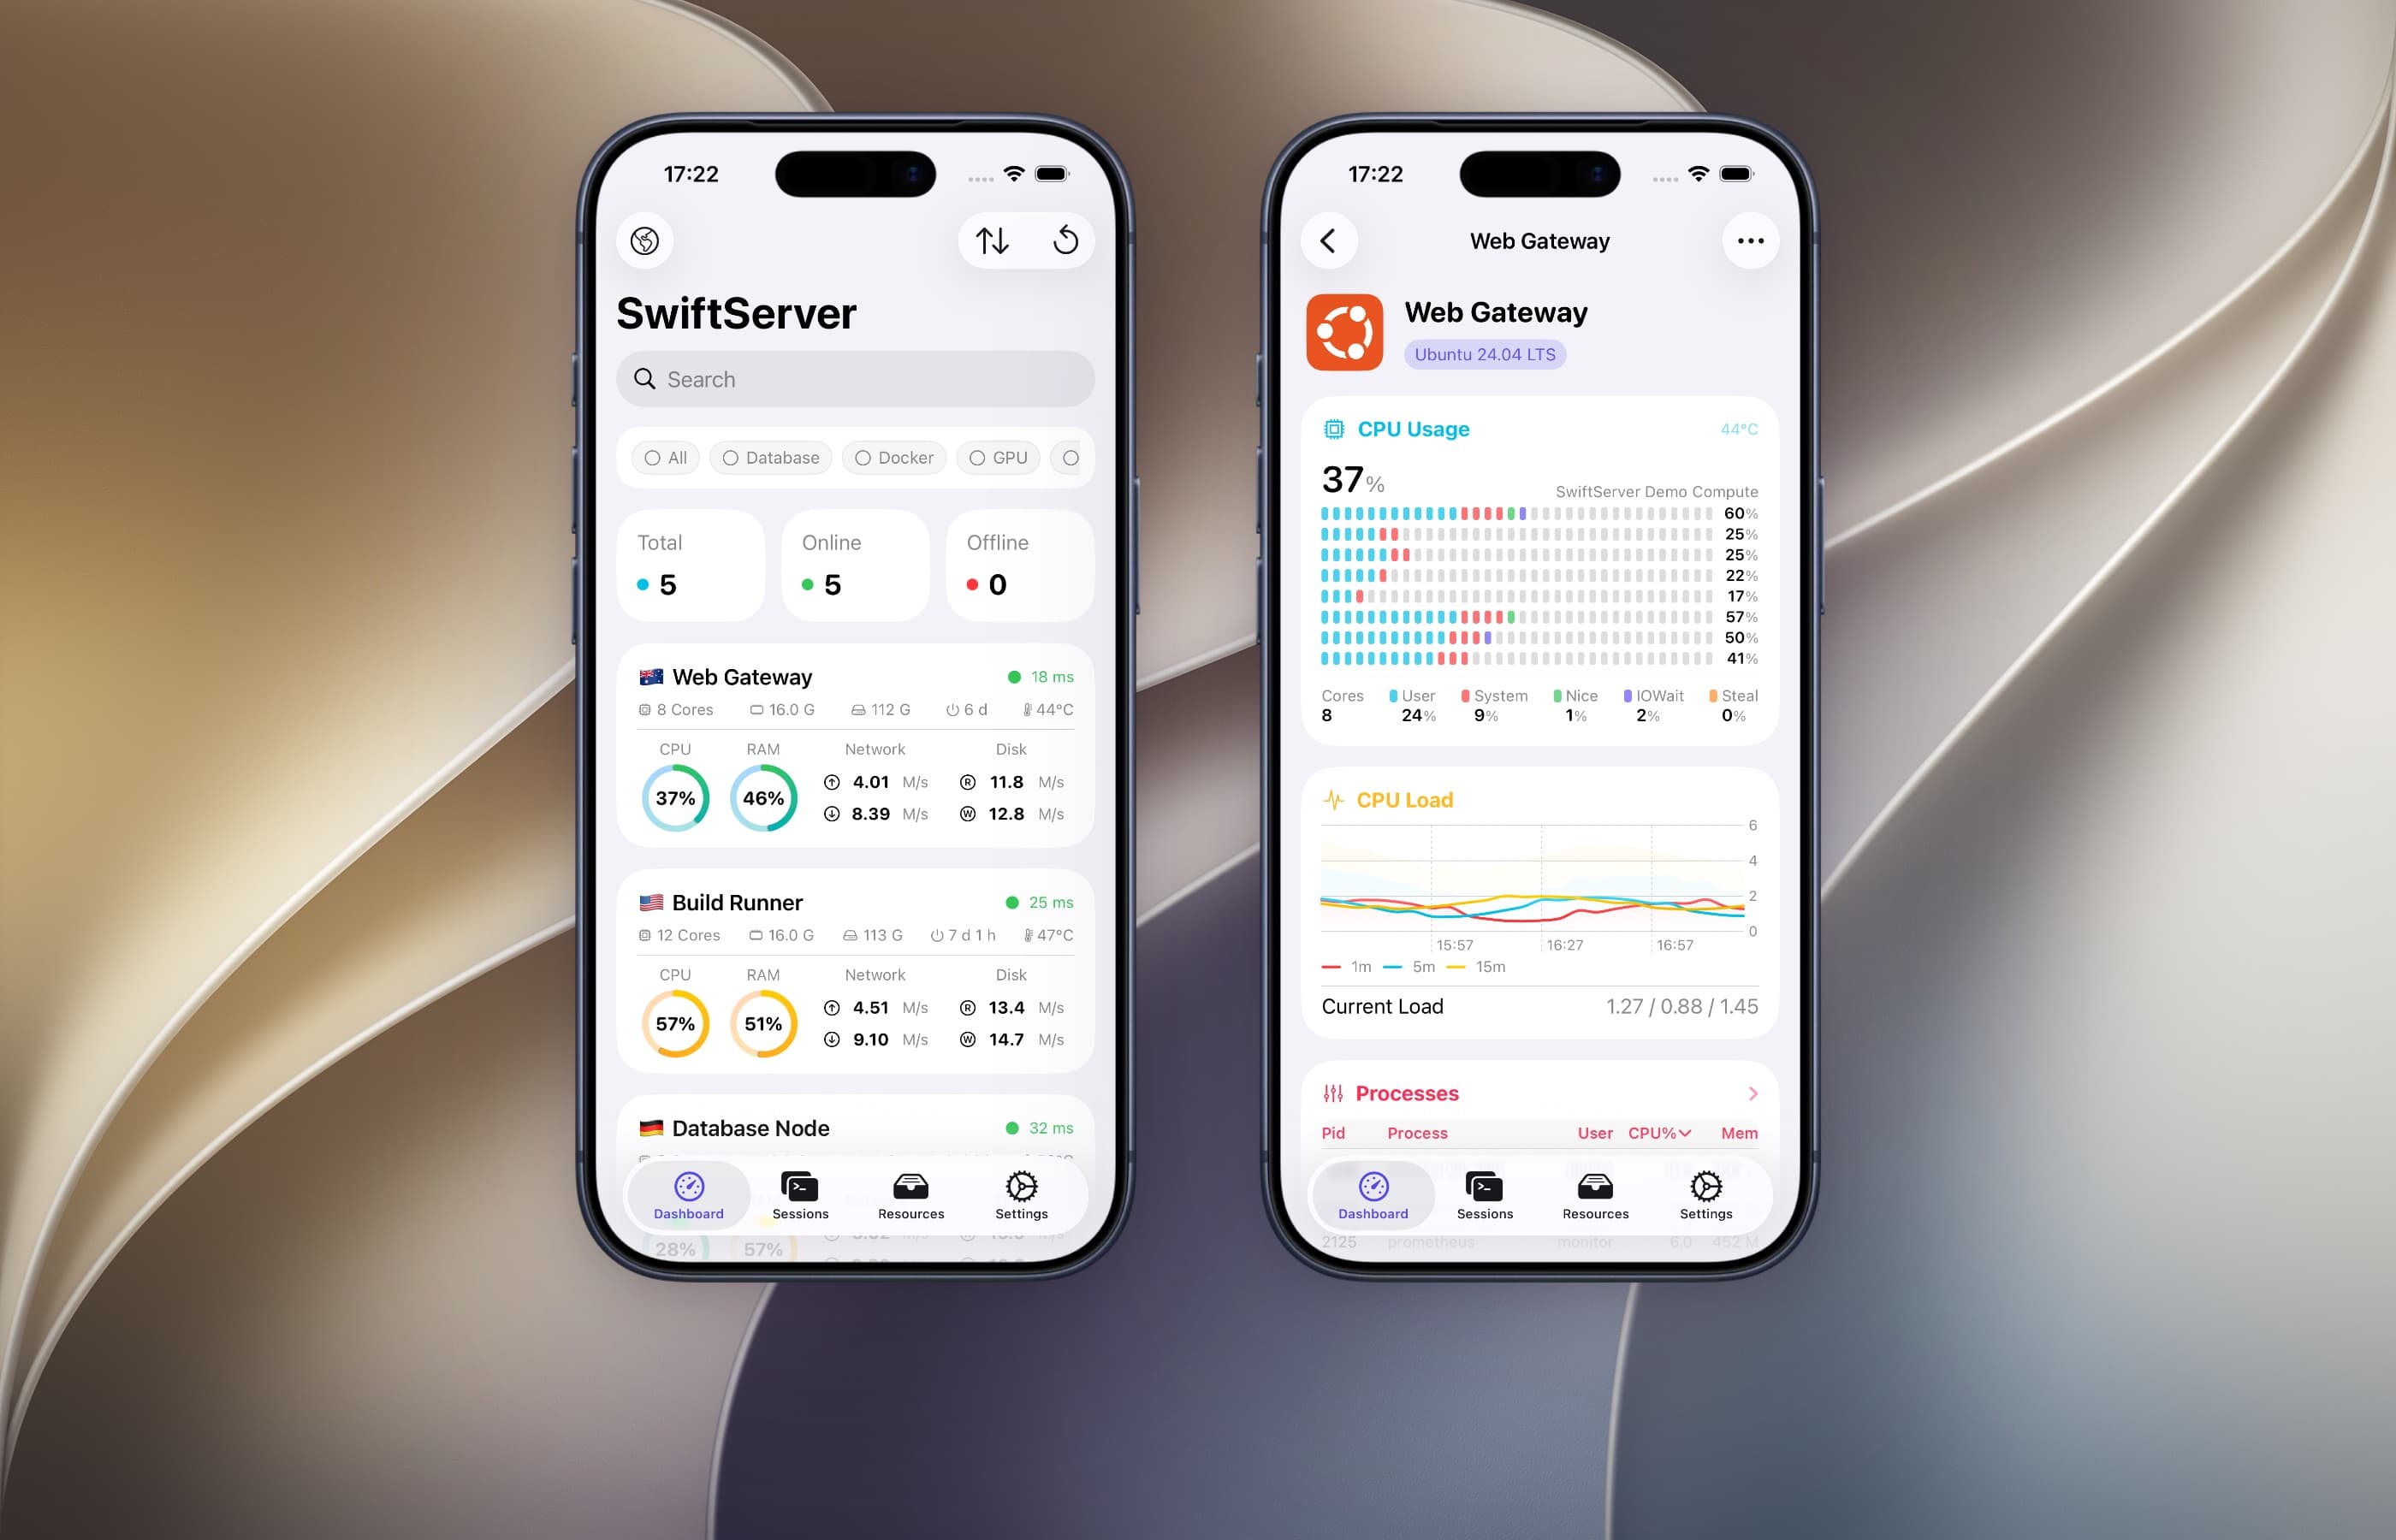
The Dashboard puts every server on one screen, with total, online, and offline counts at the top. Each machine's card shows CPU and memory gauges, network and disk throughput, cores, memory, storage, uptime, temperature, and latency. Search, tag filters, and drag-to-reorder keep a long list manageable, and the refresh interval runs from once a second to once a minute. Global View maps every online server with a flag, its name, and live latency, and exports the map as a light or dark PNG. Restart Machine sends the right reboot command for Linux, macOS, or Windows and follows the machine until it is back.
Status Detail Layout lets you add, remove, and reorder the cards on the status page, and on iPad and Mac lay them out in one to four columns.
Widgets and Live Activities
Two Home Screen widgets show the numbers outside the app: Overview, with total, online, and offline counts, and Machine, with one server's CPU, memory, network, disk, uptime, temperature, and latency, plus a refresh button. On the Mac the same widgets sit on the desktop. A Live Activity counts running terminal, SFTP, and port forwarding sessions in the Dynamic Island and on the Lock Screen.

Every platform, and the other half of the app
Linux distributions from Ubuntu to Alpine, OpenWrt routers, Raspberry Pi, and Proxmox hosts report through standard commands, and macOS servers over the same SSH. Windows hosts connect over OpenSSH and report through PowerShell. Panels that do not apply to a platform are hidden.
The same app has a full SSH and Mosh terminal, SFTP, port forwarding, jump hosts, and a Docker panel that speaks the Docker Engine API through the SSH connection, so no Docker port is exposed. It needs no account and syncs through your own iCloud. The monitoring page and GPU page go into detail.
Best for: anyone who wants the whole picture of a server, on any Apple device, without touching the server.
Price: monitoring for three servers is free, along with the terminal, Mosh, and SFTP. Premium unlocks unlimited servers and is $1.99 a month, $9.99 a year, or $34.99 once.
2. ServerCat
ServerCat is a compact dashboard for Linux boxes. The free tier reads CPU per core, GPU, memory, network, disk, and Docker over SSH. Its metrics come from /proc, so macOS servers show partial data and Windows is unsupported. The terminal, iCloud sync, container creation, and background SSH are Premium.
Best for: a cheap, simple dashboard for a few Linux servers.
Price: monitoring free. Premium is $5.99 a year or $18.99 once.
3. NeoServer
NeoServer pairs monitoring with SSH and Mosh, SFTP, Docker and Podman, batch scripts, and Wake-on-LAN. Its monitoring covers load, CPU with temperature, memory, GPU with processes, disk IOPS and I/O wait, and network, for Linux hosts only. It is a phone app first. The Mac version carries the iPhone layout onto a desktop display and uses nothing of the Mac itself, and App Store reviews call it neglected, with text too small for a desktop screen. It is subscription-first and closed source, and its privacy label lists usage data collection.
Best for: iPhone-only users who want every tool in one subscription.
Price: $3.99 a month, $24.99 a year, or $59.99 once.
4. ServerBox
ServerBox is free and open source under the AGPL. Over SSH it reads CPU, memory, disk, network, GPU, temperature, S.M.A.R.T., processes, systemd, and Docker or Podman on Linux, Unix, and Windows. An optional agent adds history, push alerts, widgets, and Apple Watch support. It is built with Flutter, and the App Store Mac version is the iPad app running on Apple silicon; a separate DMG is on GitHub.
Best for: people who want open source and are willing to install an agent for alerts.
Price: free.
5. Docker Server Admin
Docker Server Admin is built around containers. It shows host load, CPU, memory, disk I/O, network, and per-container stats, and includes a terminal with jump hosts and SOCKS5. The Mac version is the iPad app on Apple silicon.
Best for: a Docker-centric view of a Linux host.
Price: Docker Pro is $29.99 or $59.99 depending on the tier.
6. WhaleDeck
WhaleDeck is a Docker manager with host metrics on the side: CPU, memory, disk, and network for the host, and the state of each container. It has no terminal.
Best for: managing containers without a shell.
Price: $2.99 a month, $20.99 a year, or $57 once.
7. Nezha Mobile
Nezha Mobile is a client for the open-source Nezha dashboard, which needs an agent on every host. It covers CPU, memory, disk, and network on Linux, Windows, macOS, and OpenWrt, and comes with an Apple Watch app.
Best for: anyone already running Nezha.
Price: $0.99.
What about Netdata and Datadog?
Both have iPhone apps that read from the vendor's cloud, where an agent on each host sends its metrics. The mobile apps are mostly alert viewers: Netdata's delivers notifications, and Datadog's shows dashboards you have to build in the web app. If you already pay for either platform, its app is worth installing for alerts, though neither replaces an app that connects to the server itself.
How to pick
To see every server in one app and drop into a shell on the one that looks wrong, choose SwiftServer. It is the only one here that does this natively on iPhone, iPad, and Mac, for Linux, macOS, and Windows hosts. Otherwise, ServerCat is lighter for a few Linux machines, ServerBox is the open-source pick when push alerts matter more than a native app, and Docker Server Admin and WhaleDeck suit servers that are mostly containers.
FAQ
What is the best server monitoring app for iPhone? SwiftServer. It reads CPU, memory, disk, network, processes, and NVIDIA GPU over SSH with nothing installed on the server, covers Linux, macOS, and Windows hosts, and puts a full terminal, SFTP, and a Docker panel next to the metrics. Monitoring three servers is free.
Can I monitor a server from my iPhone without installing anything on it? Yes. SwiftServer, ServerCat, NeoServer, and ServerBox read metrics over an SSH connection using standard system commands. Netdata and Datadog need an agent on each host and route the data through their cloud.
Can an iPhone app monitor a Windows server? SwiftServer and ServerBox do. SwiftServer connects to Windows over OpenSSH and reads CPU, memory, disk, network, processes, and GPU through PowerShell.
Which iPhone app shows GPU usage?
SwiftServer, ServerCat, NeoServer, and ServerBox show NVIDIA GPU utilization. SwiftServer adds VRAM, temperature, fan, power draw, and the processes holding each card, read from nvidia-smi. There is a guide to checking a GPU server from your iPhone.
Do these apps monitor in the background? SwiftServer refreshes its widgets and Live Activities on a schedule, and on the Mac a menu bar panel keeps sampling after the last window closes. Push alerts need an agent, which is what ServerBox's optional monitor and Nezha provide.
Is there a free server monitoring app for iPhone? SwiftServer monitors three servers for free with no account. ServerCat's monitoring is free, and ServerBox is free and open source.
SwiftServer is free to download on the App Store. To see it on a specific machine, start with monitoring a Raspberry Pi from your iPhone.
Related posts
September 21, 2026
The Best SSH Client for iPhone in 2026
Eight SSH apps for iPhone and iPad compared on terminal quality, Mosh, SFTP, port forwarding, jump hosts, monitoring, Docker, sync, and price, with a pick for each kind of user.
August 5, 2026
How to monitor a Raspberry Pi from your iPhone
Turn on SSH, add the Pi as a machine, and its CPU, temperature, memory, storage, and network arrive on your phone within seconds. Nothing to install on the Pi.