
Every core, broken down
Overall usage with the CPU model, and a row per core split into user, system, I/O wait, and more.
Live status for every machine, over the SSH connection you already use. Add a host, and the first card fills in within seconds.


Each server gets a stack of cards, from processor to disks. A card appears only when the machine has something to show.
Overall usage with the CPU model, and a row per core split into user, system, I/O wait, and more.
The one, five, and fifteen minute averages on one chart, so a spike and a slow climb look different.
Memory in use is shown apart from cache Linux can reclaim, so 90 percent stops looking alarming.
A live table, heaviest first and sortable by any column. Open it to search by name, user, or PID.
Live throughput and totals for the busiest interface. With vnStat, history reaches back years.
Capacity for every volume, and speed, latency, and IOPS for every disk.
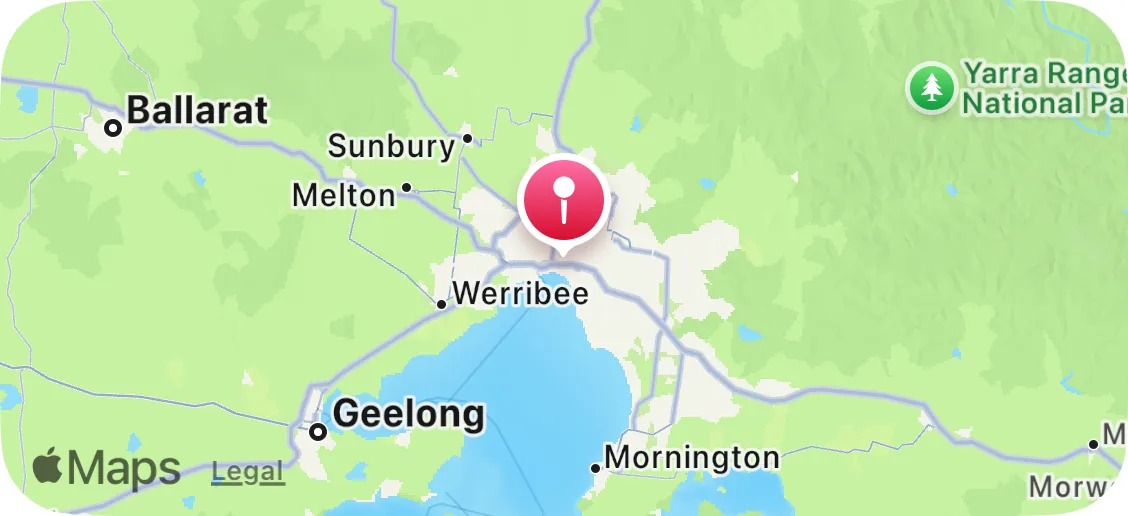
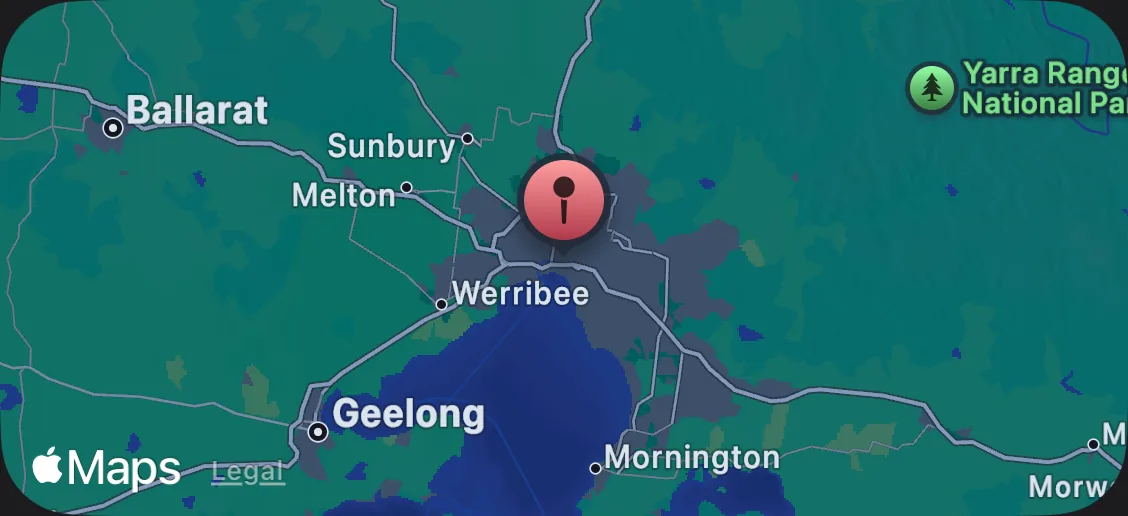
Public IP, country, city, organization, and a map pin. The lookup runs from your server to ipinfo.io, and the result stays on your device.
A tile per container with CPU, memory, network, and disk I/O. The full Docker panel is one tap away.
Utilization, VRAM, temperature, and power for every NVIDIA card, plus the processes using it.
SwiftServer
Total
4
Online
4
Offline
0
Each server gets a stack of cards, from processor to disks. A card appears only when the machine has something to show.

Each card answers one question about the machine.
Overall usage with the CPU model, and a row per core split into user, system, I/O wait, and more.
The one, five, and fifteen minute averages on one chart, so a spike and a slow climb look different.
Memory in use is shown apart from cache Linux can reclaim, so 90 percent stops looking alarming.
A live table, heaviest first and sortable by any column. Open it to search by name, user, or PID.
Live throughput and totals for the busiest interface. With vnStat, history reaches back years.
Capacity for every volume, and speed, latency, and IOPS for every disk.
Public IP, country, city, organization, and a map pin. The lookup runs from your server to ipinfo.io, and the result stays on your device.
A tile per container with CPU, memory, network, and disk I/O. The full Docker panel is one tap away.
Utilization, VRAM, temperature, and power for every NVIDIA card, plus the processes using it.
Read-only
Uses the tools already on the server, and leaves nothing running.
Linux, macOS, Windows
Each system is read its own way, and fills in on the first connection.
Your refresh rate
Set it for each machine, from once a second to once a minute.
On the Home Screen
Widgets show which servers are online, or one machine in full. Live Activities keep sessions on the Lock Screen.
SwiftServer recognizes each system on the first connection and reads it the right way.
Linux
Home lab
macOS and Windows
Add a machine
Host, port, user, and a password, an SSH key, or a saved Identity. Keyboard-interactive prompts are supported as well.
Trust the host key
The first connection shows the endpoint, the SHA256 fingerprint, and the server banner. Trust it once and it is remembered.
Turn on Show Status in Dashboard
This is what makes a machine appear as a monitored card. The free tier monitors three at a time, and saved hosts are unlimited.
SwiftServer detects the OS
It identifies the distribution or operating system and reads the machine the way that system expects.
Metrics start arriving
The cards fill in within seconds. Open one for the full chart, the process table, or the breakdown by interface.
No. SwiftServer runs read-only commands over the SSH connection you already use and reads what comes back. There is nothing to install on the server and nothing new listening on a port.
Linux, macOS, and Windows. Linux has the full card set. macOS has no vnStat traffic history. Windows has no Docker panel, load average, or temperature, but it does include NVIDIA GPU.
Yes. Anything that runs Linux and accepts SSH gets the Linux card set, including Raspberry Pi OS, Proxmox VE hosts, and OpenWrt routers with their BusyBox userland. There is nothing to install on them.
The dashboard refresh defaults to 5 seconds and can be set anywhere from 1 to 60 seconds. Longer-term readings, such as traffic history, refresh on their own slower schedule.
No. There are no threshold alerts and no metric notifications. SwiftServer shows state while you are looking, in the app and in the widgets.
Three at a time on the dashboard. The number of hosts you can save, connect to, and open a terminal on is unlimited. Premium removes the three-server monitoring limit.
Metric history stays in memory while the app is open. Network traffic history comes from vnStat on the server, which is why it survives a restart.
Free on iPhone, iPad, and Mac.